Isopach Map of Holocene Overburden
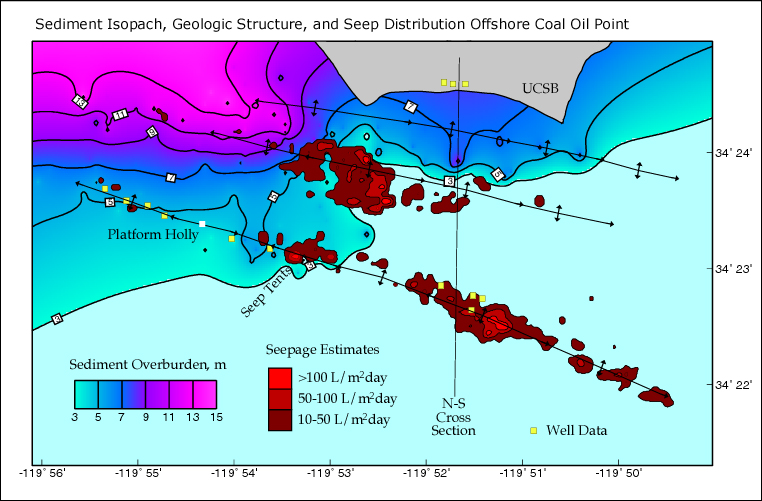
The rainbow contours correspond to thickness of overburden sediment on the ocean floor and the increasingly pink colors represent greater sediment thickness. For a larger map of the isopach contours showing data points and core locations, click here.
Seasonal variations in currents and wave action can result in a ±3 meter variation in the sediment overburden thickness.
The brown to red seep gas plume contours were generated from the August, 1996 3.5 kHz sonar survey. The location of seepage is independent of the presence of overburden.