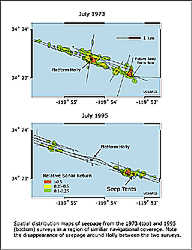
1973-1995 Seep Distribution Comparison
The following maps represent changes in seepage around platform Holly over time. The top map is from sonar data taken in 1973, while the bottom map uses sonar data from our 1995 survey. Both were made using a 3.5 kHz sonar source.
The black lines represent navigation track lines or the boat's path through the water. The Seep Tents consist of two steel pyramids (~1800 that capture gas on the ocean floor.
The cause of the change in seep area between the 1973 and 1995 sonar surveys is attributed to reduction in reservoir pore pressure at depth. The UCSB researchers propose that he oil production at platform Holly has reduced both the reservoir pressure and the extent and volume of natural seepage surrounding the platform.